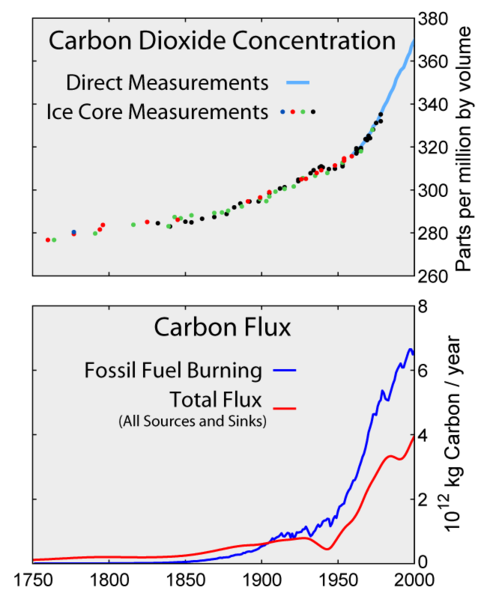
eco: global climate change in one picture
I spend (waste) time on blogs contesting global warming denialists.
The simple meta-fact is the Intergovernmental Panel on Climate Change reports on global warming are the scientific consensus (as in "the judgment arrived at by most of those concerned", not a never-gonna-happen "unanimity"). Every nation on earth, including the Bush administration in the USA, plus 40 national science academies, endorses the consensus. Fine, 18% of climate scientists think things aren't so bad or the conclusions. But that leaves 82% agreeing with the conclusions or thinking things are worse. And since IPCC 4th report came out we've seen more worrying effects.
Here's the science.
So denialists take other tacks. It's solar variation. It's methane from cow farts. There's less soot (damn environmentalists) so more sunlight. There's something else going on!
This is all true. Climate is hella complex.
http://data.giss.nasa.gov/modelforce/ is a simple summary page with a fantastic chart that shows NASA's understanding of what forces climate.

At the left is CO2, the big one. But there's also methane (CH4), nitrous oxide (N20) and chlorofluorocarbons (CFCs), also greenhouse gases that man pumps out.
Denialists like to offer solar variation as another explanation for temperature rise, but as you can see its effect is much smaller and besides, solar output has gone down in the late 90s (here's a graph and more debunking).
Denialists like to say water is the biggest greenhouse gas. This is true. Lots of things change along with climate, like water vapor, but don't make it change, hence water isn't in the NASA chart. As it gets warmer H2O in the air increases, making it worse; but we can't measurably affect the concentration of water vapor in the air.
Denialists also like to point out anomalies a long time ago, that CO2 concentration in ice cores lags temperature changes, that there have been ice ages, that it was hot (actually in Europe only) in the middle ages. All true, and understanding these helps improve climate models. But here's the chart of CO2 in industrial times. Ask your local denialist: If CO2 causing global warming is bogus now, then what's the effect of that continuing to go up and up?

The simple meta-fact is the Intergovernmental Panel on Climate Change reports on global warming are the scientific consensus (as in "the judgment arrived at by most of those concerned", not a never-gonna-happen "unanimity"). Every nation on earth, including the Bush administration in the USA, plus 40 national science academies, endorses the consensus. Fine, 18% of climate scientists think things aren't so bad or the conclusions. But that leaves 82% agreeing with the conclusions or thinking things are worse. And since IPCC 4th report came out we've seen more worrying effects.
Here's the science.
- The greenhouse gas effect is simple physics (sunlight comes in, but the greenhouse gases block infrared radiation back out).
- CO2 is a greenhouse gas. Atmospheric CO2 concentrations going up from 280ppm to 370ppm at an ever-increasing rate during the industrial age is undeniable, and billions more of us burning more and more shit at the same time is undeniable.
So denialists take other tacks. It's solar variation. It's methane from cow farts. There's less soot (damn environmentalists) so more sunlight. There's something else going on!
This is all true. Climate is hella complex.
http://data.giss.nasa.gov/modelforce/ is a simple summary page with a fantastic chart that shows NASA's understanding of what forces climate.

At the left is CO2, the big one. But there's also methane (CH4), nitrous oxide (N20) and chlorofluorocarbons (CFCs), also greenhouse gases that man pumps out.
Denialists like to offer solar variation as another explanation for temperature rise, but as you can see its effect is much smaller and besides, solar output has gone down in the late 90s (here's a graph and more debunking).
Denialists like to say water is the biggest greenhouse gas. This is true. Lots of things change along with climate, like water vapor, but don't make it change, hence water isn't in the NASA chart. As it gets warmer H2O in the air increases, making it worse; but we can't measurably affect the concentration of water vapor in the air.
Denialists also like to point out anomalies a long time ago, that CO2 concentration in ice cores lags temperature changes, that there have been ice ages, that it was hot (actually in Europe only) in the middle ages. All true, and understanding these helps improve climate models. But here's the chart of CO2 in industrial times. Ask your local denialist: If CO2 causing global warming is bogus now, then what's the effect of that continuing to go up and up?

Labels: eco


0 Comments:
Post a Comment
Links to this post:
Create a Link
<< Home